Benchmark: homogenization
Wall time of the FEM elasticity homogenization example
(examples/homogenization.py, fused stiffness kernel), across log-spaced 3D
grid sizes. Lower is better.
Test machine & code version
- CPU: AMD Instinct MI300A Accelerator (192 logical cores)
- GPU: 4x AMD Instinct MI300A
- muGrid:
0.110.0-9-g3cf17e02-dirty— run 2026-06-30T15:55:33
Run configuration: 3D single spherical inclusion, fused stiffness kernel,
6 load cases, fixed 100 CG iterations per load case — i.e. a fixed work
budget so every configuration performs identical arithmetic. Times are the
solver wall time (total_time_seconds, excluding setup).
Time vs. grid size
The plot below merges several ways of running the same solve on this machine:
- CPU (1 core) — a single core, MPI disabled. muGrid's compute kernels carry no OpenMP, so a non-MPI CPU run uses exactly one core. Only swept up to 128³; a single core is hopeless beyond that.
- CPU (92 cores, MPI) — the whole CPU via MPI domain decomposition
(
mpiexec -n 92), the grid split into per-rank subdomains that exchange ghost layers each iteration. - GPU (1 device) — a single GPU.
- GPU (N devices, MPI) — several GPUs via MPI domain decomposition, one rank per device (round-robin).
Each configuration is swept to the largest grid that still fits in memory: the
first size that runs out of memory is recorded as OOM in the table and
dropped from the plot, and larger sizes for that configuration are not attempted.
| Configuration | 16³ (4k) | 24³ (14k) | 32³ (33k) | 48³ (111k) | 64³ (262k) | 96³ (885k) | 128³ (2.1M) | 192³ (7.1M) | 256³ (16.8M) | 384³ (56.6M) | 512³ (134.2M) | 768³ (453.0M) | 1024³ (1073.7M) | 1536³ (3623.9M) |
|---|---|---|---|---|---|---|---|---|---|---|---|---|---|---|
| CPU (1 core) | 1.07 | 3.67 | 8.63 | 29.1 | 69.4 | 234 | 556 | — | — | — | — | — | — | — |
| CPU (92 cores, MPI) | 0.123 | 0.158 | 0.225 | 0.568 | 0.956 | 3.33 | 7.14 | 24.2 | 56.8 | 194 | 441 | 1.43e+03 | 3.45e+03 | — |
| GPU (1 device) | 0.806 | 3.17 | 20.4 | 125 | 399 | 415 | 418 | 397 | 357 | 346 | 309 | OOM | — | — |
| GPU (4 devices, MPI) | 0.735 | 1.38 | 3.45 | 11.9 | 78.2 | 384 | 413 | 460 | 437 | 445 | 411 | 395 | 398 | OOM |
(values are solve time in seconds; OOM = the run ran out of memory)
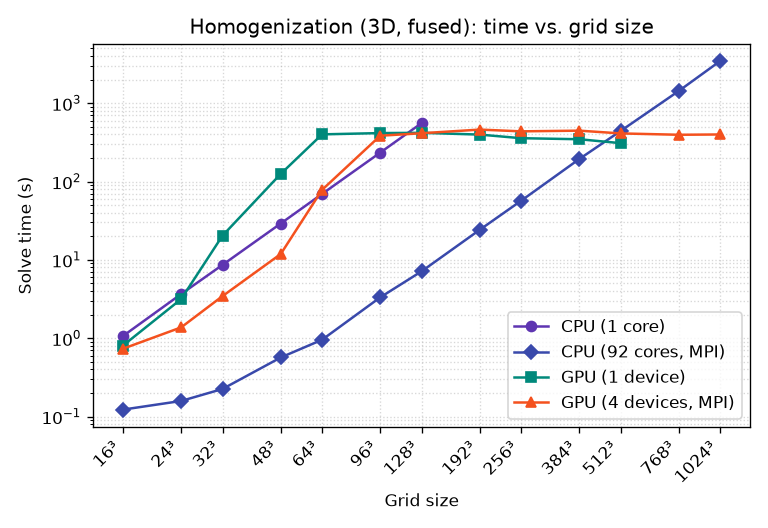
A single CPU core is quickly left behind, so the fair comparison is the full CPU
(all 92 cores via MPI) against the GPU(s). The GPU leads in the mid-range,
where the heavy per-point FEM stiffness kernel keeps it busy and the working set
fits in device memory. The largest grids are reached only by MPI domain
decomposition — across all CPU cores, or across several GPUs (one rank per
device, round-robin) — which is also what pushes each curve's memory ceiling out
before the OOM cutoff.
All data points live in the shared benchmark database benchmarks/results.csv
(date, code version, machine, parameters, results). This page is generated by
examples/benchmark_homogenization.py; re-render it from the database (no
recompute) with --render-only, or run a fresh measurement that appends a new
dated row set: